Monitoring Tools

I am an DevOps Consultant learning new tools and technology.
APICA
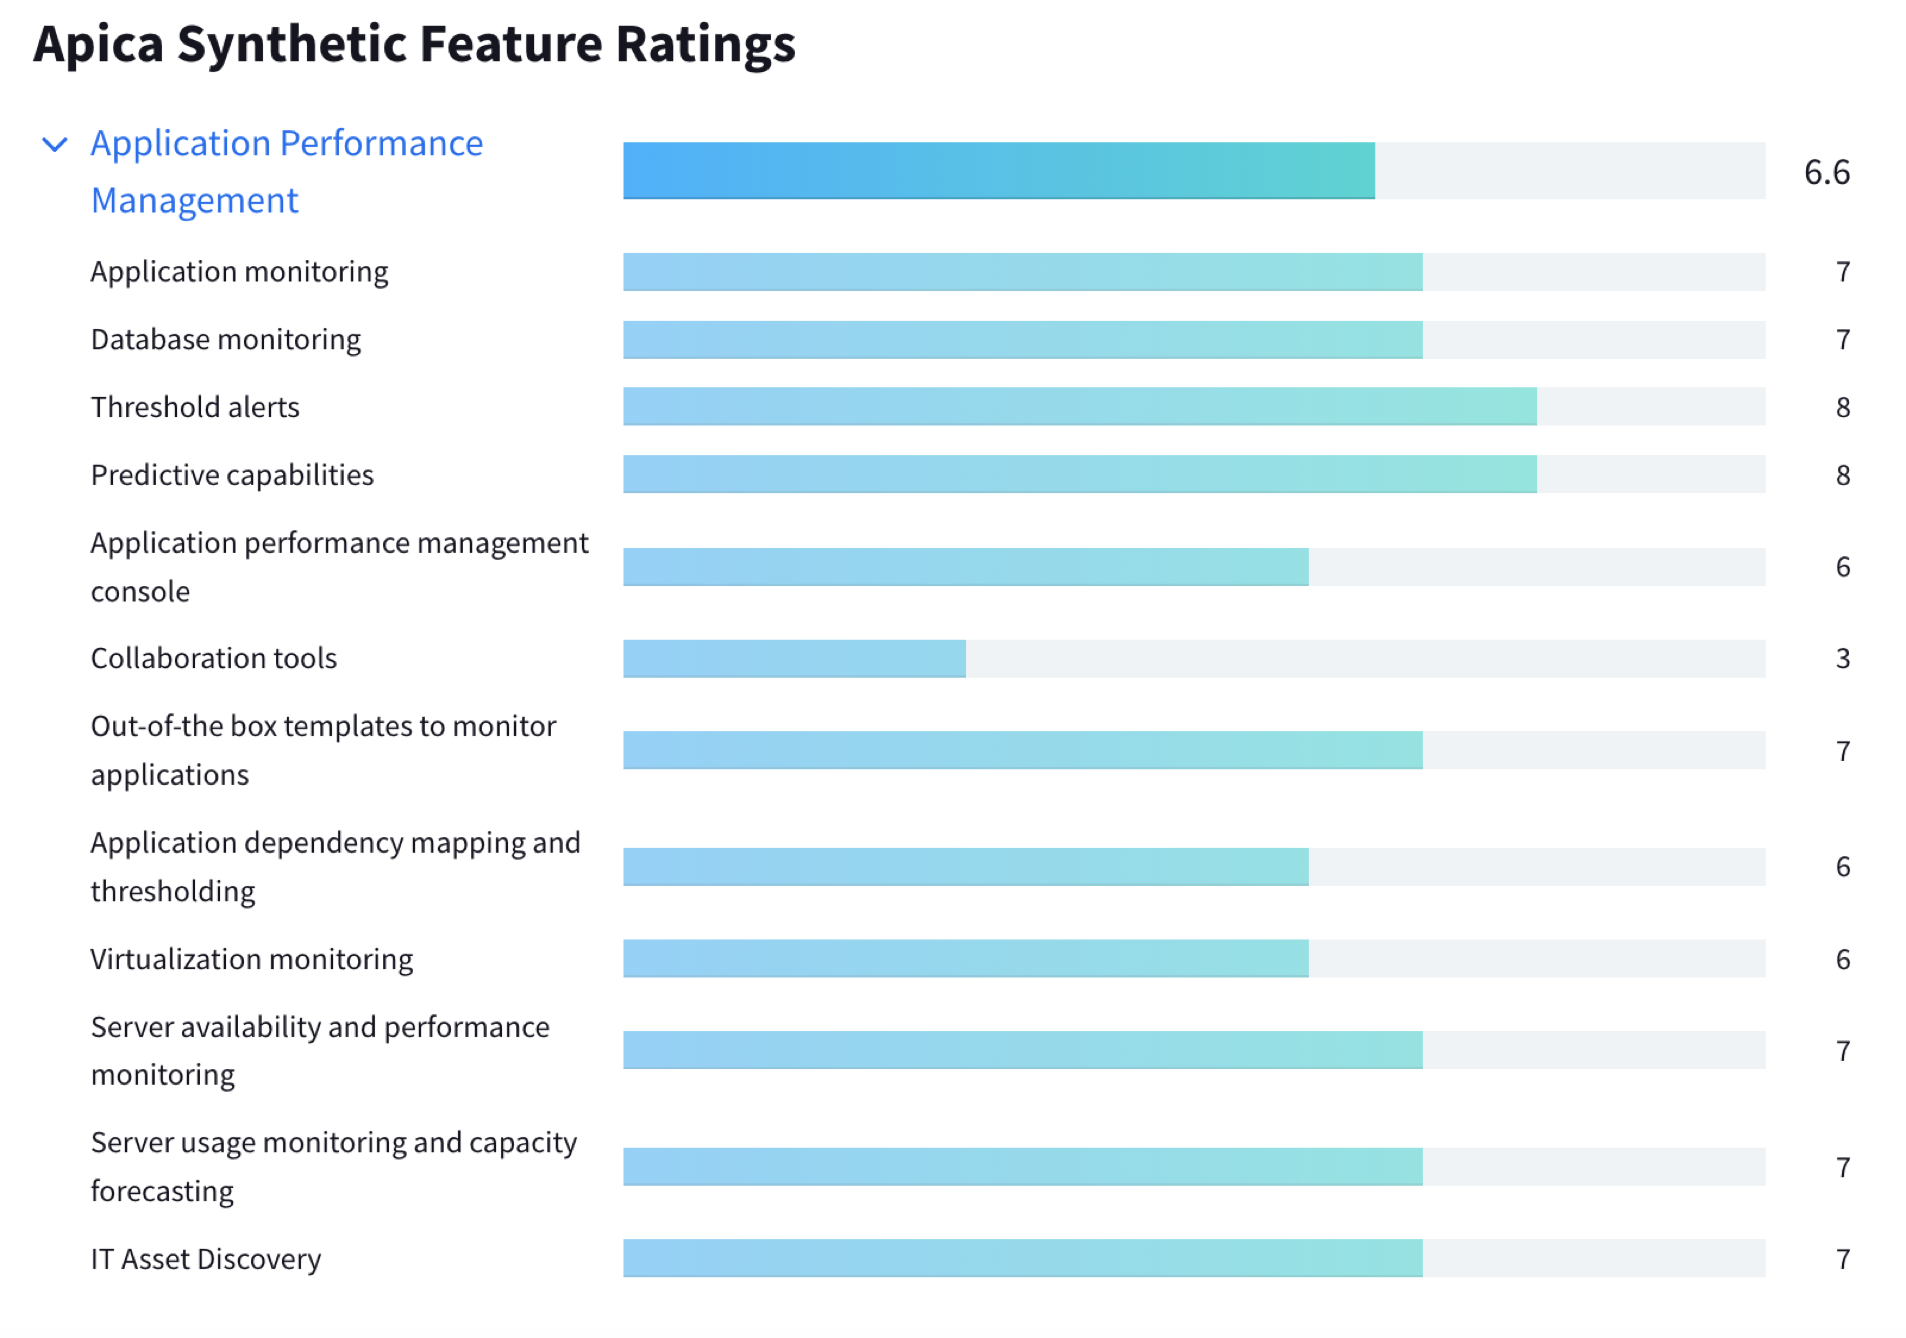
Apica WebPerformance is a synthetic monitoring platform. It features pre-release and scalability testing and can integrate with other reporting and analysis programs.
The Apica platform offers a controlled environment where you can reduce false positives and minimize variables. You must deliver the crucial transactions they depend on to guarantee the pleasure of your users both internal users and customers. Applications, APIs, and websites should all be actively monitored round-the-clock to spot performance and availability issues before they affect users.
You can identify any problems that affect user experience with the Apica platform in place, including page load time and size, network instability, third-party suppliers, and more.
Solutions include Advanced IoT Testing and Monitoring, Multi-Infrastructure Performance Monitoring, Streaming, Mobile Application Monitoring, API Monitoring, and IT Monitoring
Dynatrace
Dynatrace provides customizable dashboards to visualize the metrics, and to get quick and focused access to the data required to monitor the environments.
Its major capabilities are full-stack monitoring, real-time log management and analysis, debugging code in production, tracing application performance bottlenecks, and profiling CPU and memory usage.
Also includes a full topological model with distributed tracing, code-level detail, entity relationships, and even user experience and behavioural data.
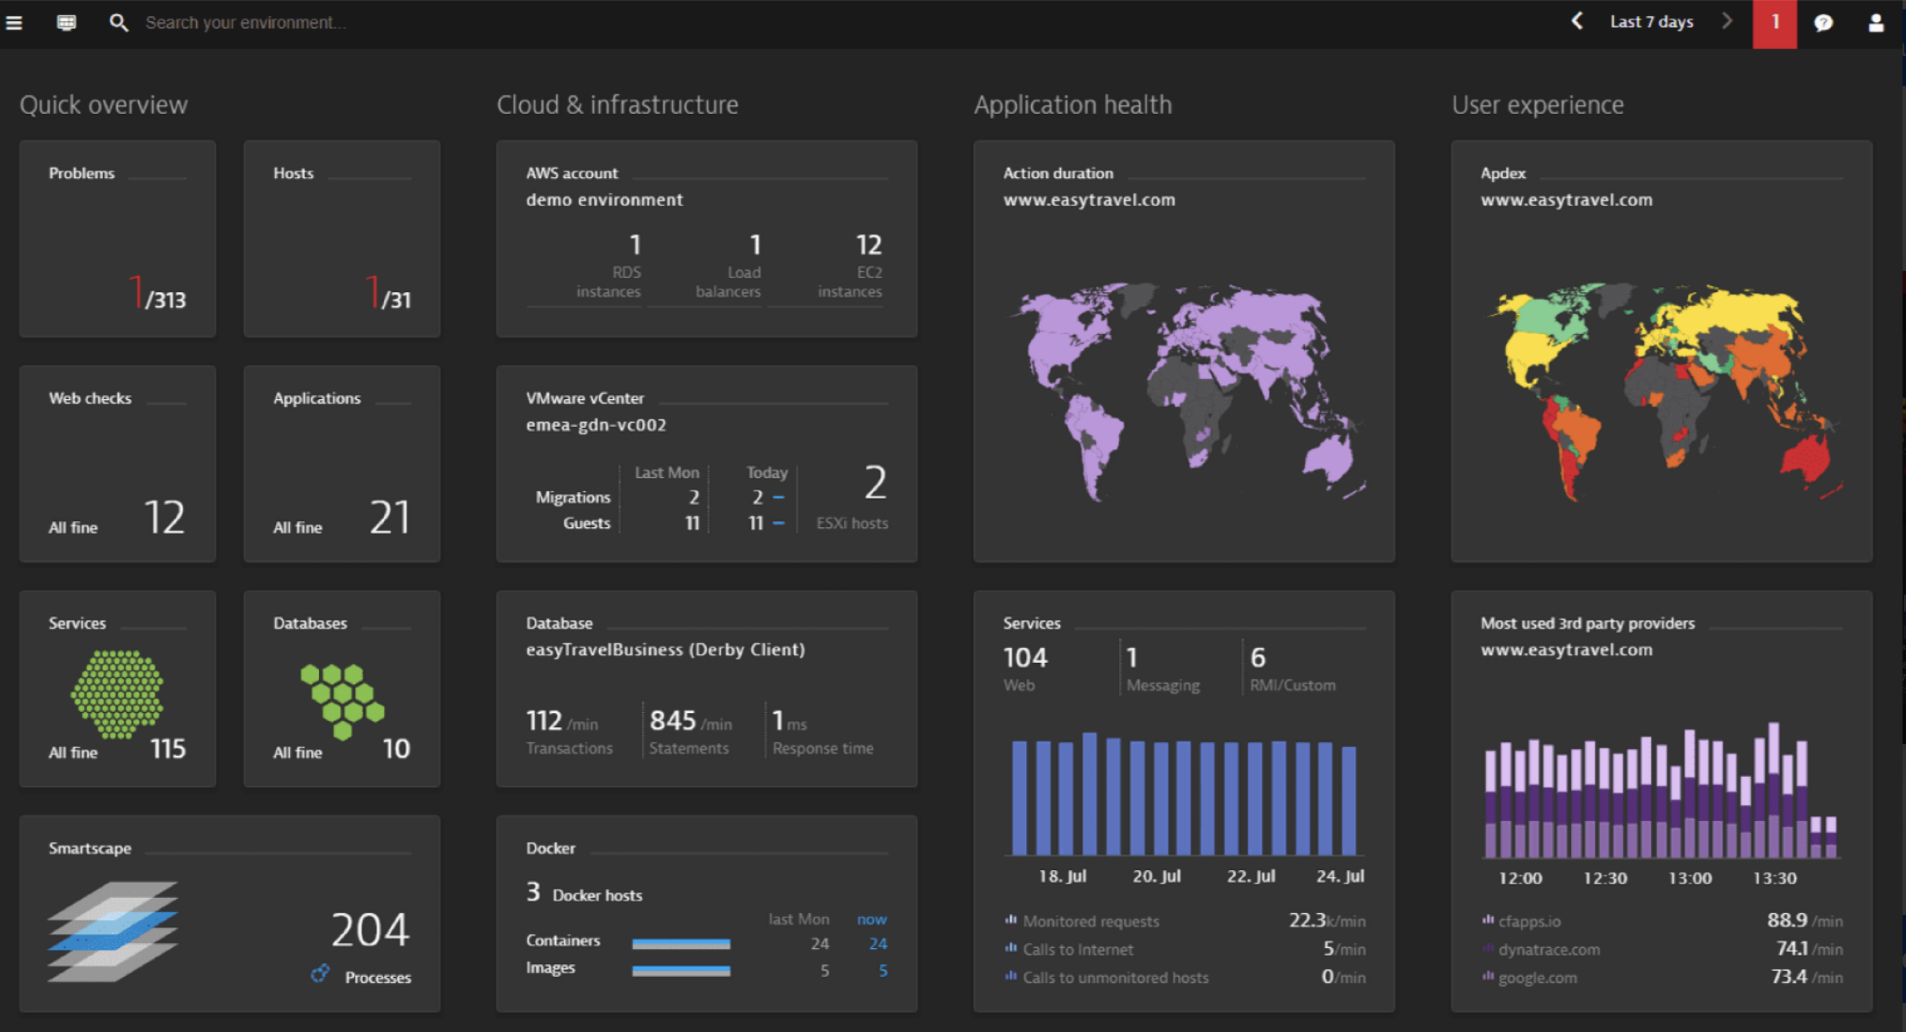
Dynatrace automatically discovers and monitors dynamic microservice workloads running inside containers on Kubernetes, using OneAgent technology and open-source solutions like OpenTelemetry. Understand modern cloud technologies, from serverless to message queues, and how they are performing, how they communicate with each other, and immediately detect poorly performing microservices.
DataDog
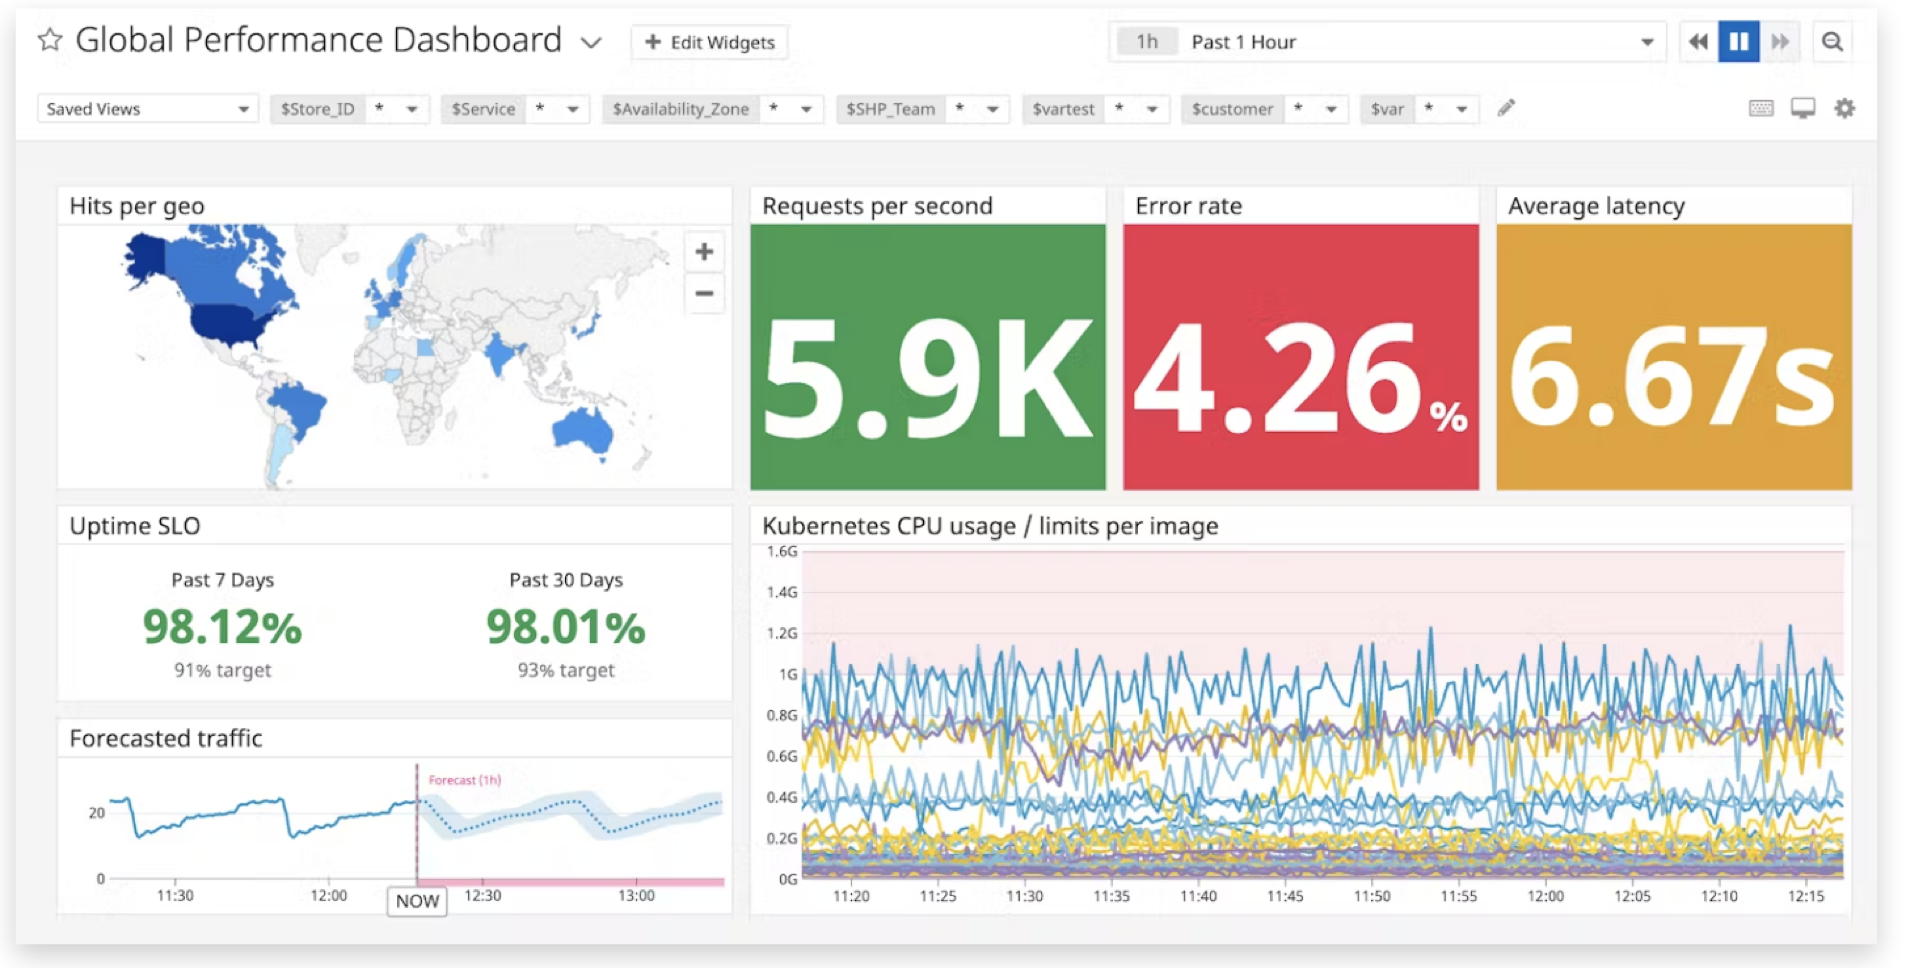
Datadog Synthetic Monitoring offers a simple way to proactively monitor your endpoints with simple tests that are run from a large number of locations at different intervals. This ensures that all the layers of your systems are validated and there are no breakdowns or failures.
Datadog uses a Go-based agent and its backend is made from Apache Cassandra, PostgreSQL and Kafka.
This synthetic monitoring tool can run from the cloud or your private locations giving you the option to monitor the performance of your application from behind the firewall. This option is easily deployable with Docker and gives you the chance to compare the experience of your users from both the outside and inside of your network.
Datadog is a fully integrated monitoring service that helps companies detect and resolve performance issues before they reach end users. With over 200 integrations, Datadog is one of the most common user tools in the industry.
The user interface includes customizable dashboards that can show graphs composed of multiple data sources in real-time. Datadog can also send users notifications of performance issues on any set metric, such as compute rates. Users are notified through means such as email, Slack or PagerDuty.
Zabbix
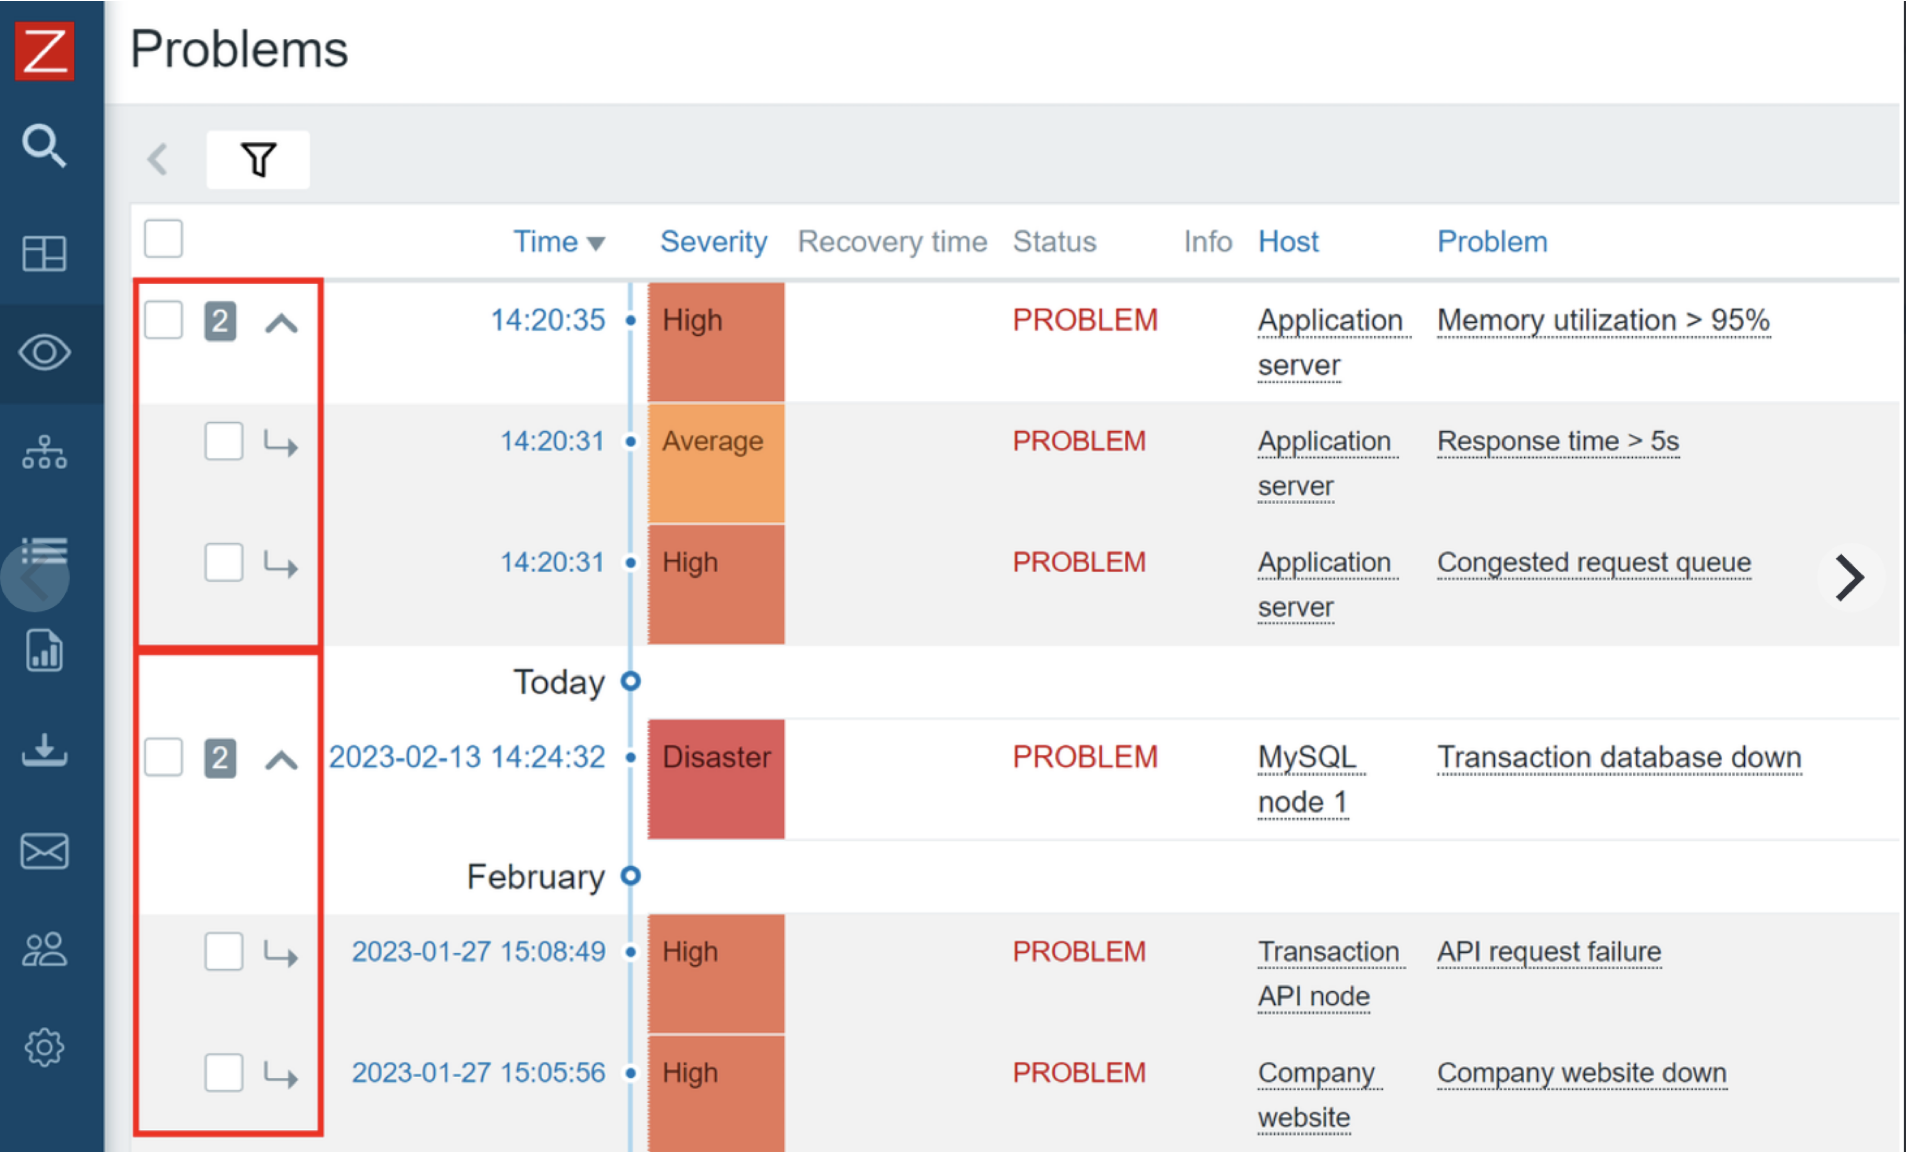
Zabbix is an open-source monitoring software tool for diverse IT components, including networks, servers, virtual machines (VMs) and cloud services. Zabbix provides monitoring metrics, such as network utilization, CPU load and disk space consumption.
It includes prebuilt official and community-developed templates for integrating with networks, applications, and endpoints, and can automate some monitoring processes.
Uptime.com
Uptime.com is a site observing arrangement with manufactured checking capacities, that monitors sites and servers from everywhere in the world. It assists clients with ensuring their administrations are continually accessible and working as expected and tells them of any possible issues or blackouts. With more than 30 observing areas around the world, it offers to check at a recurrence of one moment, giving constant reports on uptime, margin time, and reaction times. It can deploy scenarios with the script recorder and is a very easy, simple and easy-to-navigate dashboard. It requires a paid account to use all features and its expensive
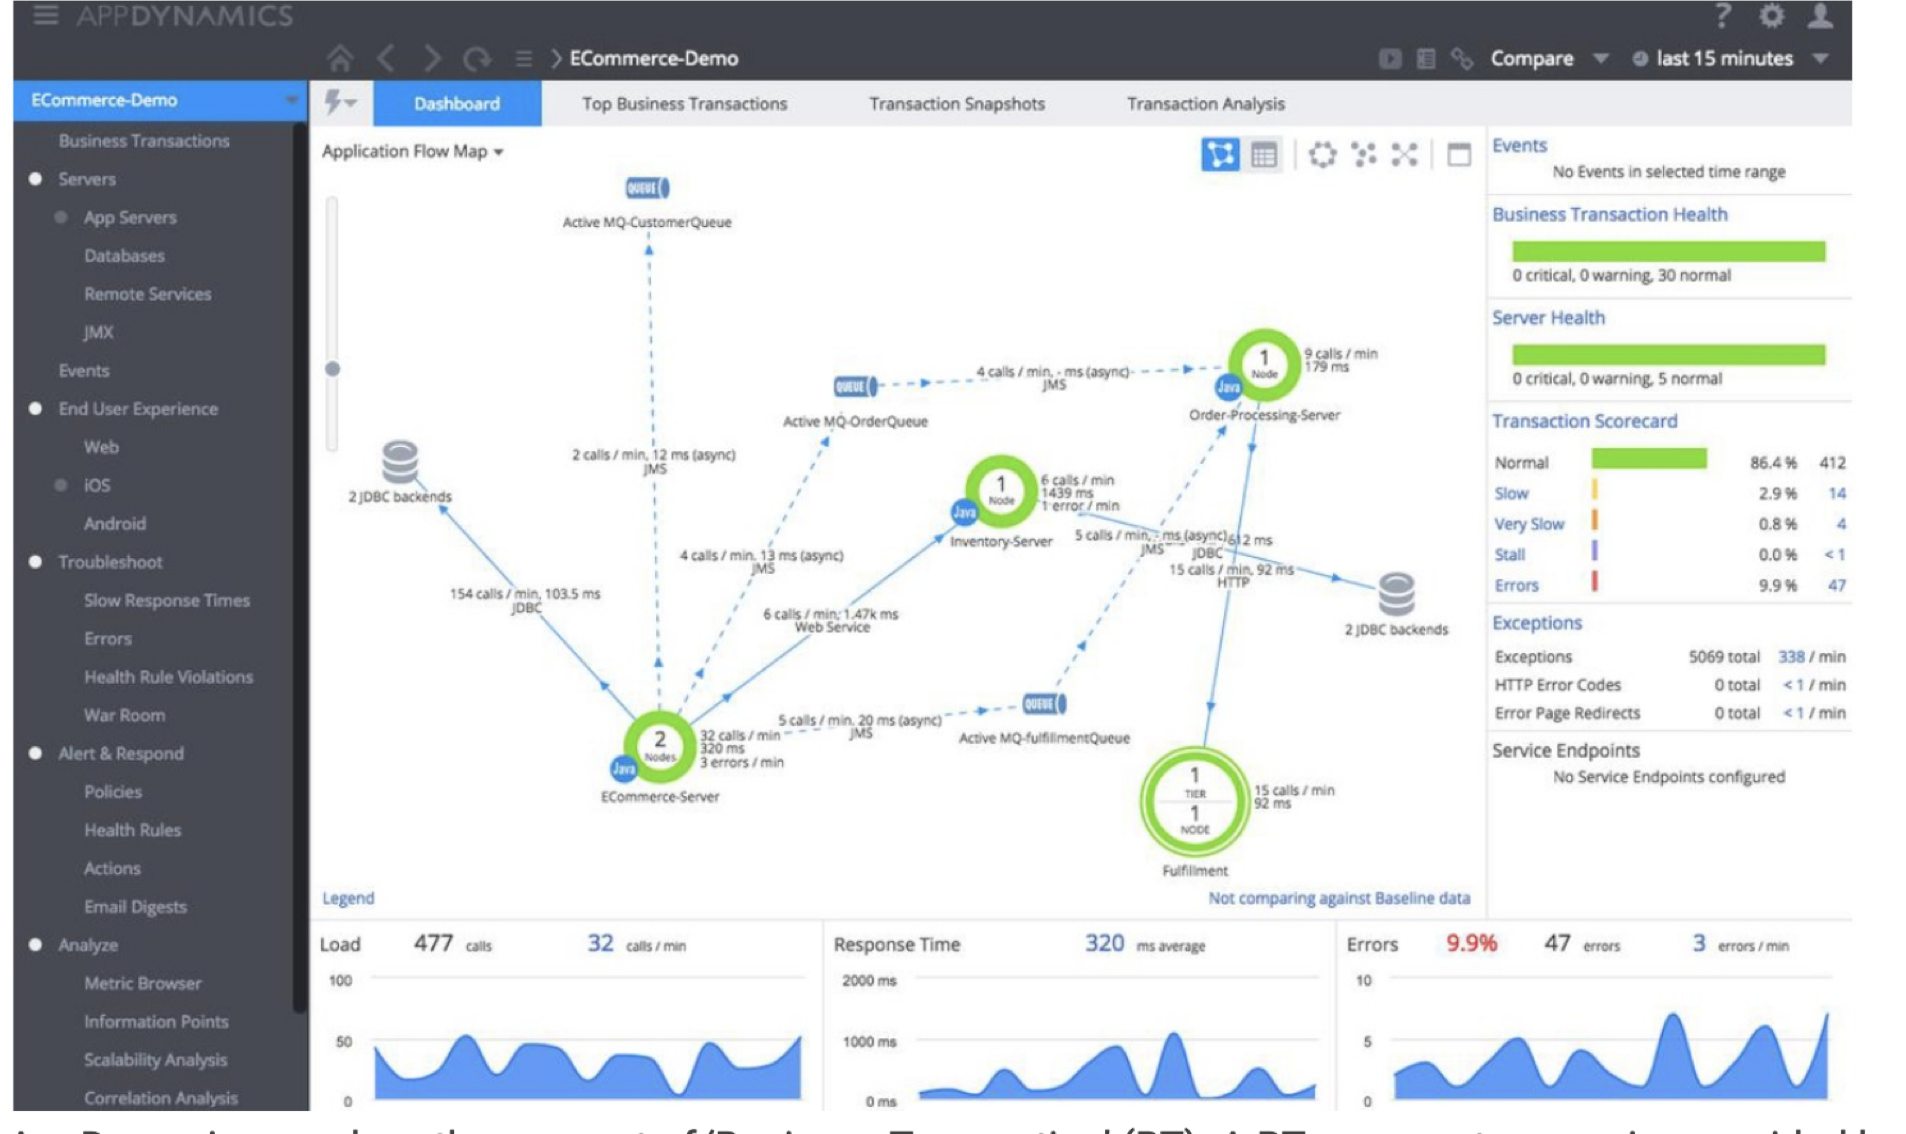
AppDynamics
AppDynamics offers real-time data visualisation in a simple to comprehend and concise way allowing you to avoid user-impacting experiences with out-of-the-box monitoring solutions. It enables you to measure and track end-user experience, you can stay confident that your app or web service is ready and able to serve users at any point in time by measuring your entire workflows, including data and user actions, through Selenium-based tests.
AppDynamics is a leading Application Performance Management (APM) product.
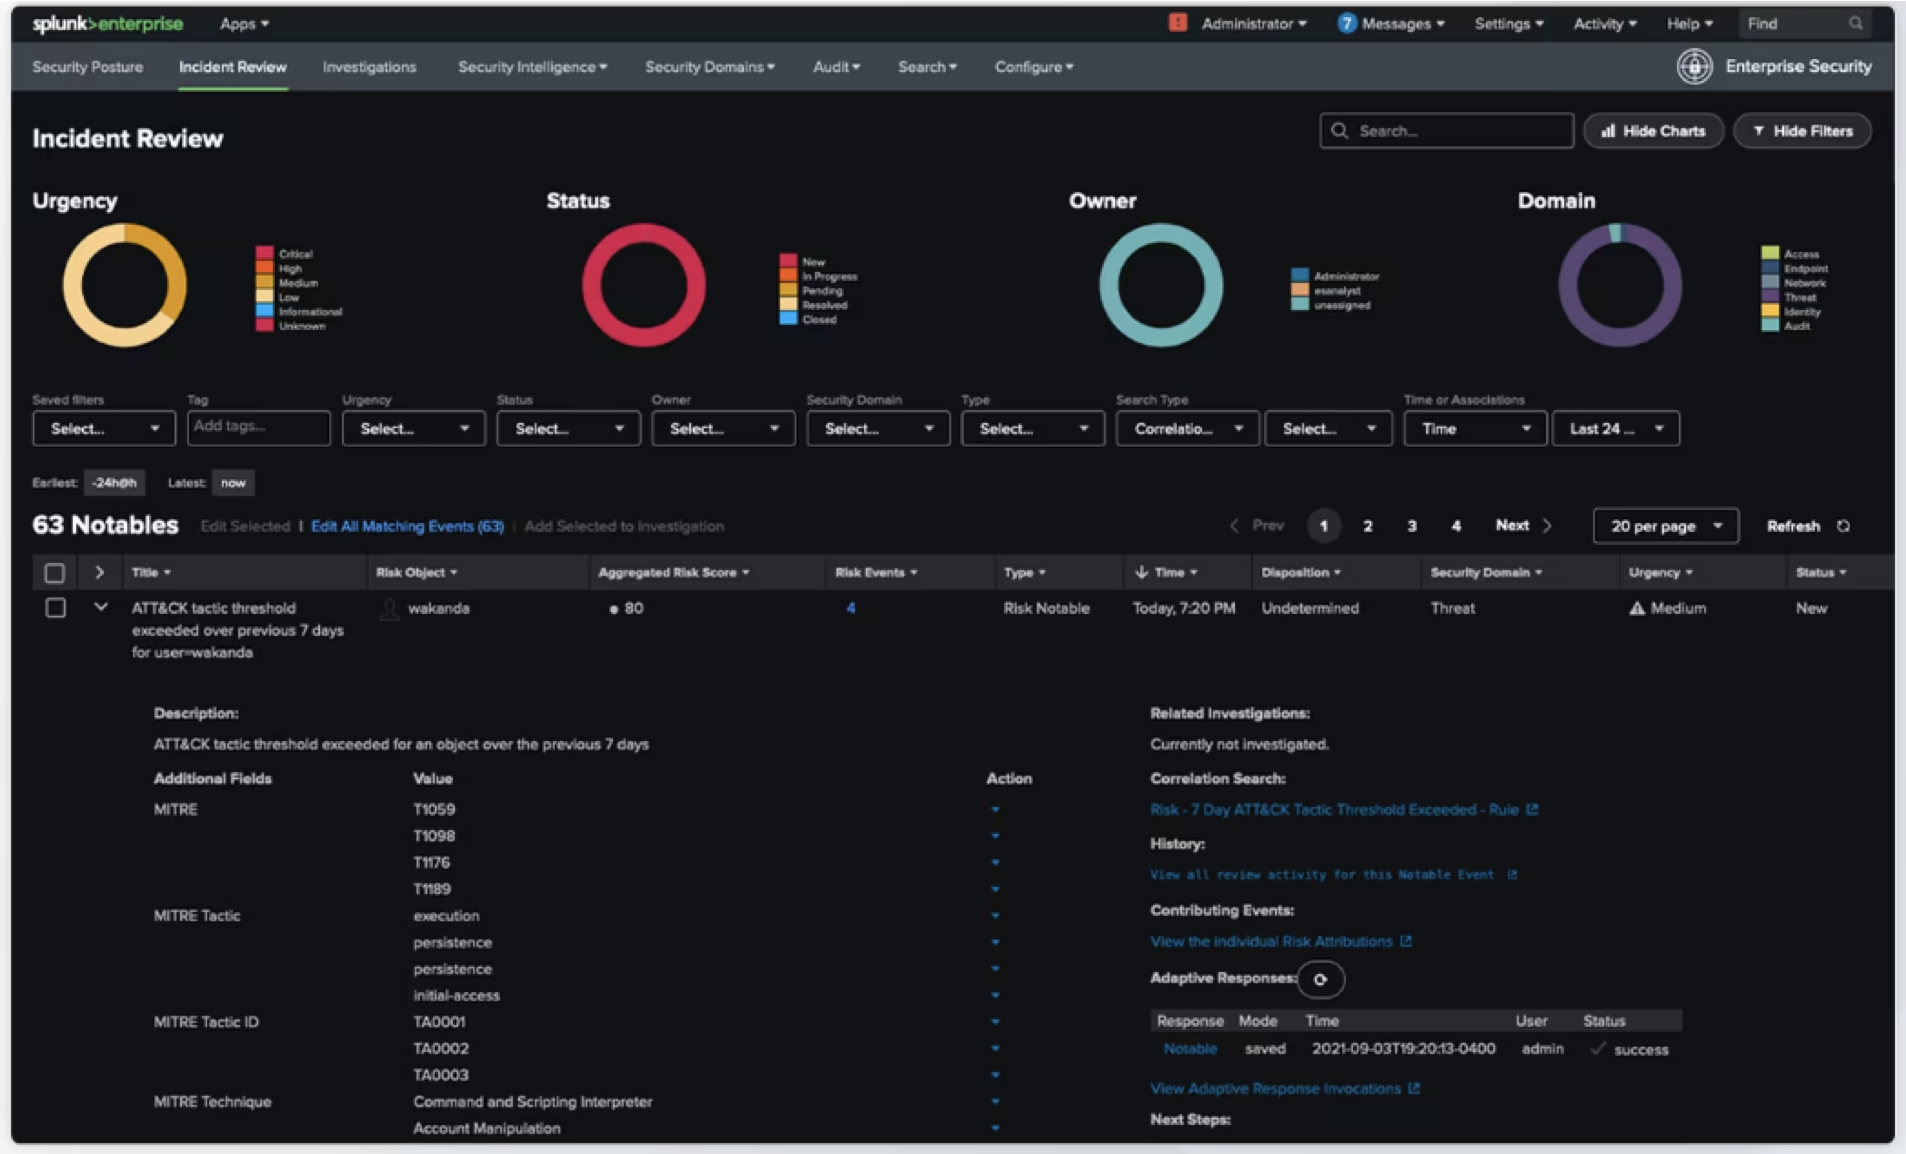
Splunk
Splunk is a software platform to search, analyze and visualize the machine-generated data gathered from the websites, applications, sensors, devices etc. which make up your IT infrastructure and business.
Splunk Cloud is a full SaaS offering from Splunk providing Splunk as a service. This allows you to quickly use the Splunk platform without needing to manage the underlying infrastructure and architecture.
It can get expensive for large data volumes. Optimizing searches for speed is more art than science
Comparison Table
Tool | Features | Free Trial | Price |
Sematext | Uptime & API Monitoring, SSL Certificate Monitoring, etc. | 14 Days | From $2 per monitor |
Pingdom | Uptime & API Monitoring, Page Speed Analysis, etc. | 30 Days | From $10/month |
New Relic | Uptime & API Monitoring, Benchmark Page Speed, etc. | 14 Days | From $49/month. |
Dynatrace | SLA Monitoring, Management of CDN & 3rd party performance | 15 Days | From $11/month |
SpeedCurve | Multiple browsers & locations, Integrate CI/CD process, Competitive benchmarking | 30 Days | From $12/month |
Catchpoint | Monitor Website, Transaction, Mobile, HTML Code etc. | 14 Days | From $15 for 10K tests |
Uptrends | Failure snapshots, bandwidth throttling, precise diagrams, etc. | N/A | From $24/month |
Site24x7 | Monitoring REST APIs, SOAP web service, etc. | 30 Days | From $9/month |
Checkly | Monitor API endpoints & vital site transactions etc. | 30 Days | From $30/month |
Datadog | Web Recorder, Full-stack Visibility, waterfall visualization, etc. | 14 Days | From $5/month |
Uptime & API Monitoring, Page Speed Analysis, etc. | 14 Days | From $67/month | |
Dotcom-Monitor | Web Services, Web Page, Web Application, Infra & Performance Counter Monitoring, Load/Stress Testing | 30 Days | From $19.95 |
Better Uptime | Uptime & API Monitoring, Page Speed Analysis, etc. | N/A | From $24/month |
Thank You. Hope this information helps you.


![DataDog and ELK [Elasticsearch Logstash Kibana]](/_next/image?url=https%3A%2F%2Fcdn.hashnode.com%2Fres%2Fhashnode%2Fimage%2Fupload%2Fv1686600057195%2F97348809-0801-4214-bc85-d125d126437b.png&w=3840&q=75)